How to Convert Data to Table in Excel & Google Sheets
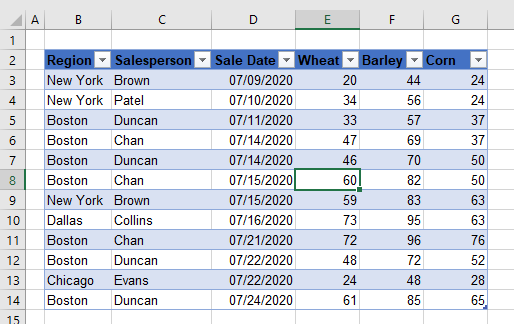
If you have existing data in a table format in Excel, you can easily convert it to a table. A table format is applied, as well as the ability to filter each column of your table. There are two ways of converting your data to a table.
Format as a Table
Consider the data below:
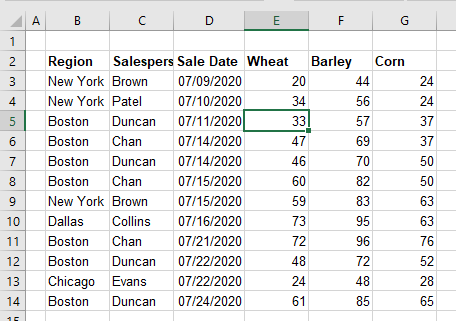
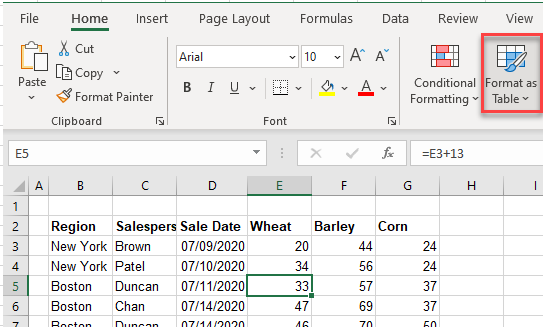
- In the Ribbon, go to Home > Styles > Format as Table.
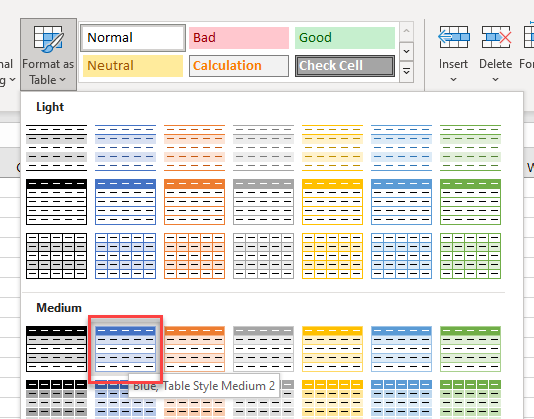
- Select the style you wish to apply to your table by clicking on it.
- The data is now converted to a table and formatted with the style chosen.
Insert a Table
You can also convert your data to a table by using the Insert Table feature.
- Click within your formatted data and then, in the Ribbon, go to Insert > Tables > Table.
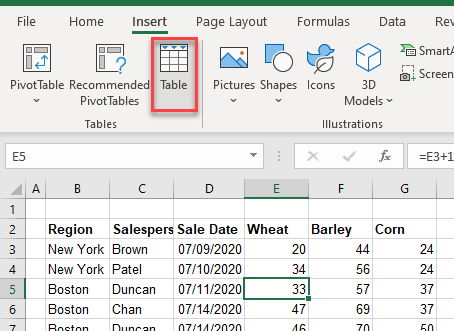
- All the data is selected. If your data has headers, make sure that option is ticked, and then click OK.
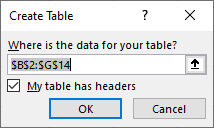
- The data is automatically converted to a table.
Also see how to convert the table back to a range or use VBA to create a table from your data.
Convert Data to a Table in Google Sheets
In Google Sheets, you can’t insert a table, but you can format cells with alternating colors.
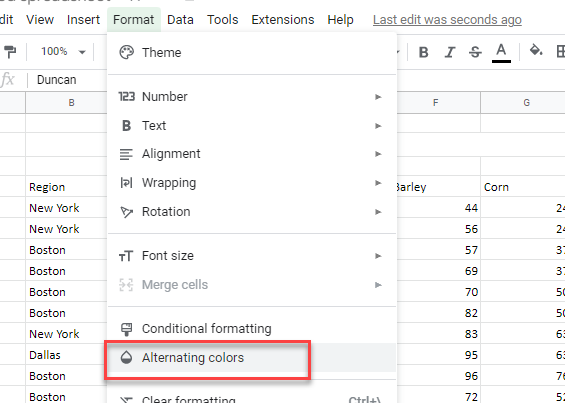
- Select the range where you want to display banded rows (B1:E8), and in the Menu, go to Format > Alternating colors.
- In the window on the right side, choose a format style (e.g., blue). You can also change colors for header and items and make your own custom style. When you have chosen your colors, click Done.
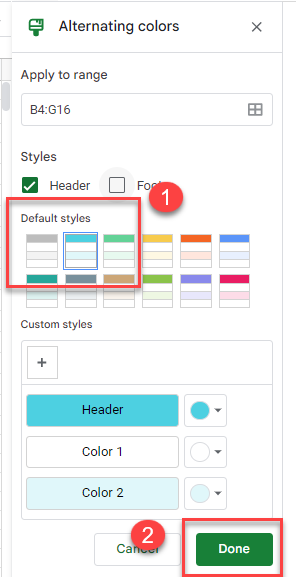
Rows are now banded (alternatively colored), but you don’t have the kind of functionality an Excel-formatted table gives you..


